Learning Courses, Certifications, Processes
10 Must Know Excel Functions for your career success
Veejay Ssudhan
April 02, 2023Excel is a powerful tool used by many individuals, from students to business professionals. It offers an array of functions that can simplify the process of data analysis and save time. Knowing the most essential Excel functions can make you more efficient and productive. Are you working in Back Office Role, Data Management, Operations or Sales? You would need to Master Excel functions.
This article outlines 10 must-know Excel functions that everyone should be familiar with in order to get the most out of this versatile program. From basic calculations to conditional formatting, this list covers the fundamentals required for effective data manipulation in Excel.
1. XLOOKUP Excel Function
XLOOKUP is one of the most revolutionary Excel functions that has been introduced in recent years. It is a powerful tool that can help users to quickly retrieve data from spreadsheets and databases, without having to use complex formulas or macros. This function allows users to search for values in a table or range, and then return corresponding values from another column. XLOOKUP offers several benefits over other Excel functions such as VLOOKUP, including greater flexibility, improved performance, and more intuitive syntax.
One of the key advantages of XLOOKUP is its ability to handle missing or incomplete data in a more efficient manner than previous Excel functions. For example, if you are searching for a value that does not exist in the range you specified with XLOOKUP, it will automatically return an error message instead of displaying incorrect information.
For instance, XLOOKUP is used when working with large datasets that require indexing and matching. In such cases, users can use XLOOKUP to retrieve specific information based on certain criteria without having to scroll through thousands of rows. For instance, if you are managing a customer database with multiple columns such as name, address, phone number, email address and purchase history you can use XLOOKUP . This can help you to quickly find out how much each customer has spent over time.
Example
It uses XLOOKUP to look up a country name in a range, and then return its telephone country code. It includes the lookup_value (cell F2), lookup_array (range B2:B11), and return_array (range D2:D11) arguments. It doesn’t include the match_mode argument, as XLOOKUP produces an exact match by default.

XLOOKUP uses a lookup array and a return array, whereas VLOOKUP uses a single table array followed by a column index number. The equivalent VLOOKUP formula in this case would be: =VLOOKUP(F2,B2:D11,3,FALSE)
XLOOKUP vs VLOOKUP
XLOOKUP is a reference function that arrived in Excel after VLOOKUP and the counterpart HLOOKUP (horizontal lookup). The difference between XLOOKUP and VLOOKUP is that XLOOKUP works no matter where the lookup and return values reside in your cell range or array. Say we have an employee table that contains the details including Emp_ID, First_Name, Last_Name, Dept, and Salary.
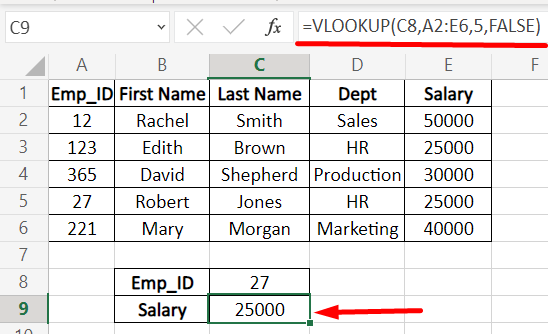
The query here is to find the employee’s salary if the Emp_ID is given.
Syntax: VLOOKUP ( lookup_value,table_array,col_index_num,[range_lookup])
2. Importing PDF Data
Importing PDF data into Excel can be a daunting task, but with the right tools and knowledge, it can be done seamlessly. Excel functions play a crucial role in this process as they enable users to manipulate and organize imported data efficiently. The first step is to convert the PDF file into an editable format such as Microsoft Word or Google Docs. This allows for easier formatting and copying of text.
Once the PDF has been converted, it is time to open Excel and begin importing the data. The ‘Data’ tab on the ribbon offers different options for importing data including ‘From Text/CSV’, ‘From Web’, and ‘From Other Sources’. Depending on how the PDF was converted, users may select any of these options to import their data accordingly.
Excel functions like ‘Text to Columns’ are useful for separating imported text into columns based on specific delimiters such as commas or spaces. The three ways you can extract data from PDF:
- Extract Data using the Simple Copy and Paste Command
- Extract Data using Microsoft Word
- Extract Data using Adobe Reader Software
3. Wildcards
One common wildcard is the asterisk (*), which represents any number of characters within a cell. For example, if you want to find all cells containing the word “cat,” you can use the formula “*cat*”. This will search for any cell containing the letters “cat” surrounded by any number of other characters.
Another useful wildcard is the question mark (?), which represents a single character within a string. For instance, if you want to find all cells with three-letter words starting with “c,” such as “car” or “cab,” you can use the formula “c?
In total, there are 3 wildcard characters you can use in Excel. You can use 2 of them as a replacement of characters, and the third one to prevent the other 2 from being registered as wildcard characters.
- ? character stands for a single character. For example, X-M?n finds both X-Men and X-Man.
- * character stands for one or more characters. For example, s*man finds both Spider-Man and Superman
- ~ character that followed by ?, *, ~ characters searches the following character without using it as a wildcard. For example, X-M~?n finds only X-M?n.
4. Upper, Lower and Proper Functions
One set of functions that you may find particularly useful are the UPPER, LOWER and PROPER functions. These three functions allow you to quickly and easily change the case of text within your Excel spreadsheet.
The UPPER function converts all letters in a cell to uppercase. This can be helpful when working with data that needs to be standardized or when formatting for presentation purposes. The LOWER function does the opposite, converting all letters in a cell to lowercase. This can also be useful for standardizing data or for cases where lowercase letters are preferred for readability.
Finally, there’s the PROPER function which capitalizes only the first letter of each word in a cell while leaving any other letters as lowercase.
The syntax for each function is basic:
- =UPPER(text)
- =LOWER(text)
- =PROPER(text)
5. Pivot Tables
Pivot tables are one of the most powerful tools in Excel functions. They allow you to summarize large amounts of data quickly and easily. It won’t ask you to write complex formulas or macros. With a pivot table, you can analyze your data from multiple angles, making it easier to spot trends and patterns that might otherwise go unnoticed.
To create a pivot table, simply select the data you want to analyze and click on the “PivotTable” button in the “Insert” tab of the Ribbon. From there, you can drag and drop fields into different areas of the pivot table to create your own custom analysis. You can group data by date, product category or any other relevant criteria that will help you better understand your business operations.
6. Sparklines
Sparklines are a type of data visualization that condenses large amounts of information into small, simple charts. They were first introduced by Edward Tufte in 2006 and have since become a popular tool in the data analysis world. Sparklines can be created using Excel functions, making them easy to integrate into your data analysis process.
One benefit of using sparklines is their ability to convey trends and patterns quickly and efficiently. When used alongside other data visualizations, such as tables or graphs, they provide a more comprehensive view of the data being analyzed. Another advantage is their compact size; because they take up minimal space on a spreadsheet, they facilitate comparisons between different sets of data.
Excel provides several functions for creating sparklines, including LINEST and TREND. These functions allow users to customize their sparklines according to specific needs and preferences.
Inserting Sparklines in Excel
- Select the cell in which you want the sparkline.
- Click on the Insert tab.
- In the Sparklines group click on the Line option.
- In the ‘Create Sparklines’ dialog box, select the data range (A2:F2 in this example).
- Click OK.
7. Transpose
The Transpose function in excel is one of the most powerful and useful tools for data manipulation. This function allows you to reorganize your data by flipping rows into columns or vice versa, without manually copying and pasting data. It can be particularly helpful when you have a large amount of information that needs to be restructured.
Using the transpose function in excel is simple, all you need to do is select the range of cells containing your data, then copy it. Next, right-click on a blank cell where you want the transposed data to appear and select ‘Paste Special’. In the dialog box that appears, check the ‘Transpose’ option under ‘Paste’, then click OK.
The great thing about using this function is that it saves time and reduces errors that may occur during manual copying and pasting.
TRANSPOSE function
- Step 1: Select blank cells. First select some blank cells. …
- Step 2: Type =TRANSPOSE( With those blank cells still selected, type: =TRANSPOSE( …
- Step 3: Type the range of the original cells. Now type the range of the cells you want to transpose. …
- Step 4: Finally, press CTRL+SHIFT+ENTER.
8. IF Statements
IF statements are one of the most powerful Excel functions that allow users to conditionally execute a formula based on certain criteria. This function evaluates a set of conditions and returns one of two outcomes depending on the result. The IF statement checks if a condition is true or false, and it can perform different actions accordingly.
One common use for an IF statement is in financial modeling. It can help in complex calculations where variables such as interest rates, loan amounts, and payment periods need to be adjusted. For instance, an investor may want to evaluate how changes in market conditions will impact their portfolio performance. In this case, they can use an IF statement to calculate potential returns under different market scenarios.
Another area where IF statements come in handy is data analysis. Complex queries for analyzing the millions of data using excel can be done by IF Statements. Use the IF function, one of the logical functions, to return one value if a condition is true and another value if it’s false. For example: =IF(A2>B2,”Over Budget”,”OK”) =IF(A2=B2,B4-A4,””)
An IF function in Excel consists of 3 components:
- A logical test, using an operator sign for logical comparison;
- A value to return if the logical test results in TRUE;
- A value to return if the logical test results in FALSE.
Format: =IF(A1>B2; “TRUE”; “FALSE”)
You can also use IF Function with 3 conditions in Excel
- Method 1: Nested IF Function. =IF(C2<15, “Bad”, IF(C2<20, “OK”, IF(C2<25, “Good”, “Great”))
- Method 2: IF Function with AND Logic. =IF(AND(A2=”Mavs”, B2=”Guard”, C2>25), “Yes”, “No”)
- Method 3: IF Function with OR Logic.
9. Convert Function
Excel is a powerful tool for data analysis, and one of its most useful features is the ability to use functions to manipulate data. One particularly useful function is the CONVERT function, which allows you to convert between different units of measurement.
The function takes three arguments:
- The value you want to convert
- The unit you want to convert from
- The unit you want to convert to.
For example, if you have a temperature in Fahrenheit and want to convert it to Celsius, you would use the formula =CONVERT(A1,”F”,”C”), where A1 contains the temperature in Fahrenheit.
In addition to converting temperatures between Celsius and Fahrenheit, the CONVERT function can also be used for converting other types of measurements such as length or volume. The function supports a wide range of units including meters, feet, inches, liters and gallons among others.
10. Trim Function
The Trim function is one of the most useful Excel functions available, and it can be used to clean up data in a variety of ways. Essentially, the Trim function removes any extra spaces that may be present within a cell’s contents, making it easier to read and manipulate the data. This can make a big difference in the quality of your spreadsheets, especially if you are working with large amounts of data.
To use the Trim function, simply select the cell or cells you want to clean up and click on “Trim” under “Text” in the “Function Library” tab. You can also use this function in combination with other Excel functions such as Concatenate or Substitute to further refine your data. With just a few clicks, you can transform messy strings of text into clear and concise information.
Is MS Excel a High Paying Job?
Looking for job openings that require MS Excel skills? You are in luck! Many companies are seeking talented individuals with experience in this powerful spreadsheet software. With MS Excel being a fundamental tool used in various industries, it is no wonder why employers are looking for candidates who have mastered this program.
If you have extensive knowledge of MS Excel, there are numerous opportunities out there waiting for you. In fact, most business organizations prioritize their hiring process to include individuals with strong analytical and organizational skills using the software. To stand out from other applicants, consider polishing your expertise on complex formulas, pivot tables, and data analysis tools within MS Excel.
Whether you’re just starting your career or looking for a new challenge, don’t let these job openings pass you by if you possess advanced proficiency in MS Excel. This skill set can open doors to various roles such as financial analyst, marketing specialist or even project manager positions.
- Back Office Executives
- Data Entry Professional
- Inventory Management Executive
- Data Analysis
- Operation Management
- Production Management
Final Thoughts
In conclusion,Excel is a powerful tool for simplifying complex tasks and analyze data quickly. Learning the Top 10 must know functions will help you using Excel efficiently. And once you have mastered these functions, you can continue to explore additional features and capabilities of Excel. This can help you to maximize your productivity. With practice and dedication, anyone can become an Excel expert. In addition, investing in yourself by learning these important functions will pay off in the long run with improved workflows and efficiency.
All Tags
Loading...
Loading...